
How to read a PWR report in PostgreSQL: a complete performance analysis guide
12 min read
How to read a PostgreSQL PWR report section by section: overall summary, expensive queries, disk I/O, locks, cache, wait events, trends — and above all how to recognize a PostgreSQL database in distress.
Downloadable resources
What is a PostgreSQL PWR report?
Reading a PostgreSQL PWR report lets you quickly understand where a database's slowdowns come from. This type of PostgreSQL performance report is particularly useful for identifying expensive queries, locks, disk I/O issues, CPU saturation and cache anomalies. For DBA, support and development teams, the PWR report is a valuable PostgreSQL performance audit tool.
A PostgreSQL PWR report is an analysis document that summarizes the database's activity over a given period, by comparing two snapshots (a "before" and an "after"). It aggregates execution statistics to show the most expensive queries, the largest wait times, sources of load, reads and writes, locks, and performance trends.
This type of PostgreSQL performance analysis report helps answer essential questions: which query is slowing down the database? Does the problem come from CPU, disk or locks? Is there a performance regression? Which table or index is consuming the most resources? Is the load tied to a specific period?
Start with the report's overall summary
The first step in reading a PWR report in PostgreSQL is to analyze the overall summary (Database Environment Summary). This section gives an immediate snapshot of the database's state during the observed window: duration of the analyzed period, number of active sessions, total execution time (DB Time), breakdown between CPU, I/O and waits, read and write activity.
If the report shows heavy activity over a short period, this can indicate an application load surge, a poorly optimized SQL query, a batch job launched too aggressively, a concurrency issue, or insufficient PostgreSQL server capacity. If, on the other hand, activity stays steady but response times are high, the problem is often more structural: missing indexes, a poor query strategy, an overly large table, or a PostgreSQL configuration to adjust.

When should a PostgreSQL database be considered in distress?
Even before drilling into query details, three simple ratios — inherited from reading an AWR report on the Oracle side — let you judge within seconds whether a PostgreSQL database is genuinely suffering or whether the observed activity is still normal.
- DB Time vs Elapsed Time — DB Time is the cumulative time PostgreSQL spent executing queries over the period; Elapsed is the real wall-clock duration between the two snapshots. If DB Time ≈ Elapsed × number of CPU cores, the load is heavy but consistent with the machine's capacity. If DB Time far exceeds that product, it's a signal of a database under strain.
- AAS (Average Active Sessions) = DB Time / Elapsed Time — healthy: AAS stays at or below the number of available CPU cores (max_worker_processes). Bad sign: AAS above the number of cores → the system is CPU-bound or spending its time waiting (I/O, locks, latches).
- CPU share of database time — healthy: 60 to 90% of DB Time spent on CPU means the database spends most of its time doing useful work. Bad sign: an abnormally low CPU share indicates that time is mostly lost in waits (I/O, locks, latches) rather than in actual computation.
- Blocked sessions and long transactions — even a single session blocked for a long time, or an "idle in transaction" transaction dragging on, can be enough to derail dozens of other queries in a cascade.
- Falling cache hit ratio — a cache hit ratio that noticeably drops from its usual value (for example below 90% when it usually runs at 99%+) signals memory pressure or an abrupt change in data volume.

Analyzing expensive PostgreSQL queries
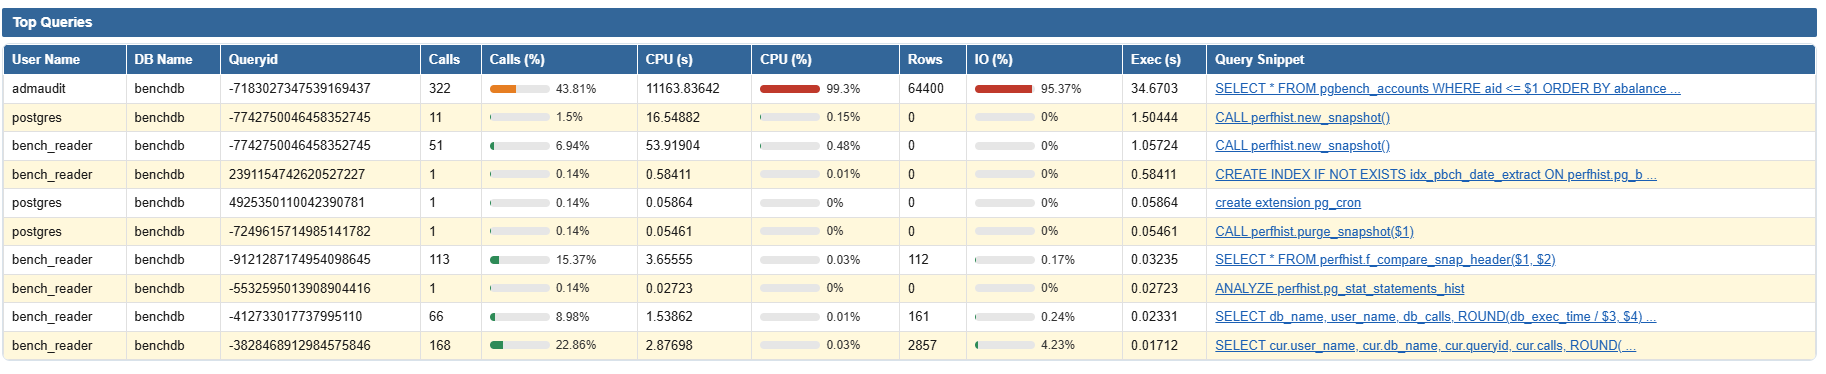
The most important section of a PostgreSQL PWR report is often the one listing the most expensive queries (Top Queries). It identifies the SQL queries that consume the most resources, based on pg_stat_statements indicators: total time, average time, number of calls, rows read and returned, cache hits (shared buffers), physical reads, writes and wait time.
A query can be problematic in several ways: a very high total time (it monopolizes a significant share of resources), a high average time (it's slow on every execution), a very high number of calls (it may not be very slow individually, but its volume makes it costly), many physical reads (it doesn't benefit enough from the cache), or a low ratio of rows returned to rows examined (it scans too much data).
If a query appears at the top of the report with a large number of executions and a dominant total time, you should check the indexes used, the execution plan, the joins, the filters, the sorts, the aggregations, the implicit conversions, and the selectivity of the WHERE conditions.
Understanding PostgreSQL reads, writes and disk I/O
PostgreSQL I/O is a very common cause of slowness. The PWR report lets you identify whether the database is waiting on disk or whether the problem lies elsewhere, through physical reads, logical (cache) reads, disk writes, temporary volumes and time spent waiting for a disk block.
A query can seem slow when it's actually mostly penalized by massive reads, insufficient cache, missing indexes, or storage that's too slow. Good sign: logical reads dominate by a wide margin, little disk access, low volume of temporary files, stable latency. Bad sign: high physical reads, storage saturation, many temporary writes, significant I/O wait time.
Reading PostgreSQL locks and blocking
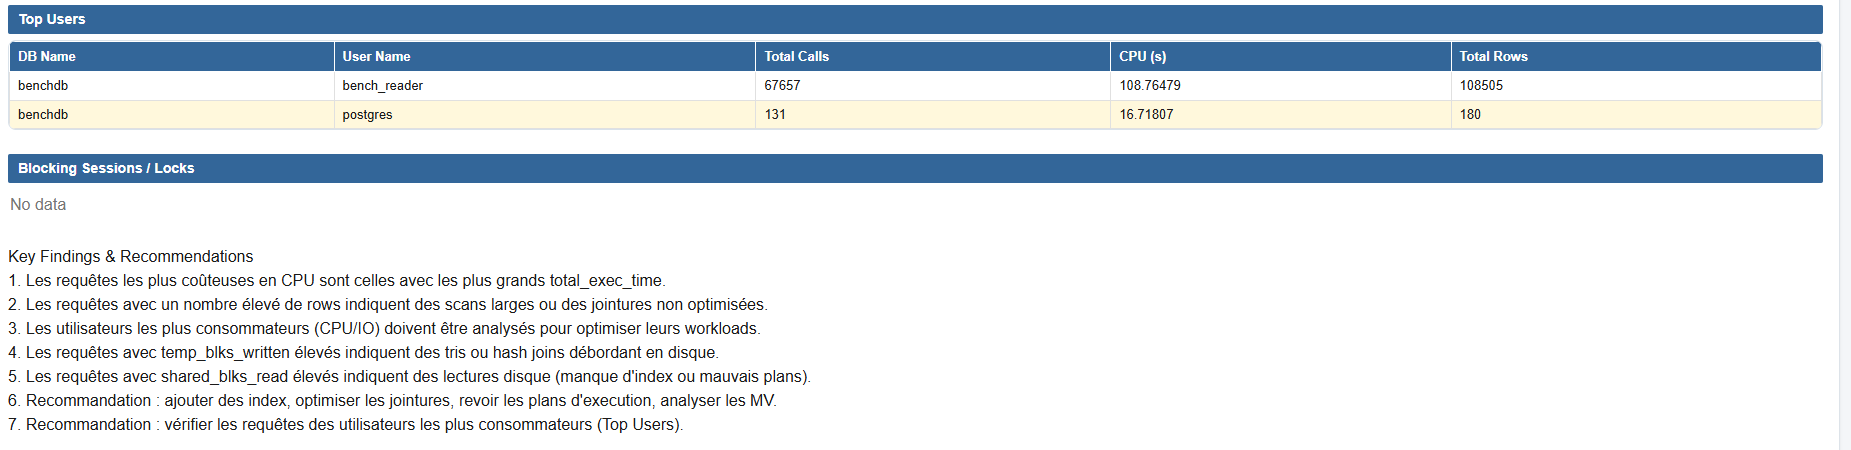
PostgreSQL locks can cause very visible slowdowns, even when the queries themselves are correct. You need to look at sessions waiting on a lock, the duration of blocking, long transactions, conflicts on the same table, deadlocks and blocking chains.
A PWR report showing a lot of time lost on locks often points to transactions left open too long, concurrent updates, poorly scheduled maintenance operations, or an application model that too often locks the same rows. Typical symptoms: users reporting a general slowdown, queries that look fast but are stuck waiting, a sudden increase in response time, cascading effects across several services.
Checking PostgreSQL memory usage and cache
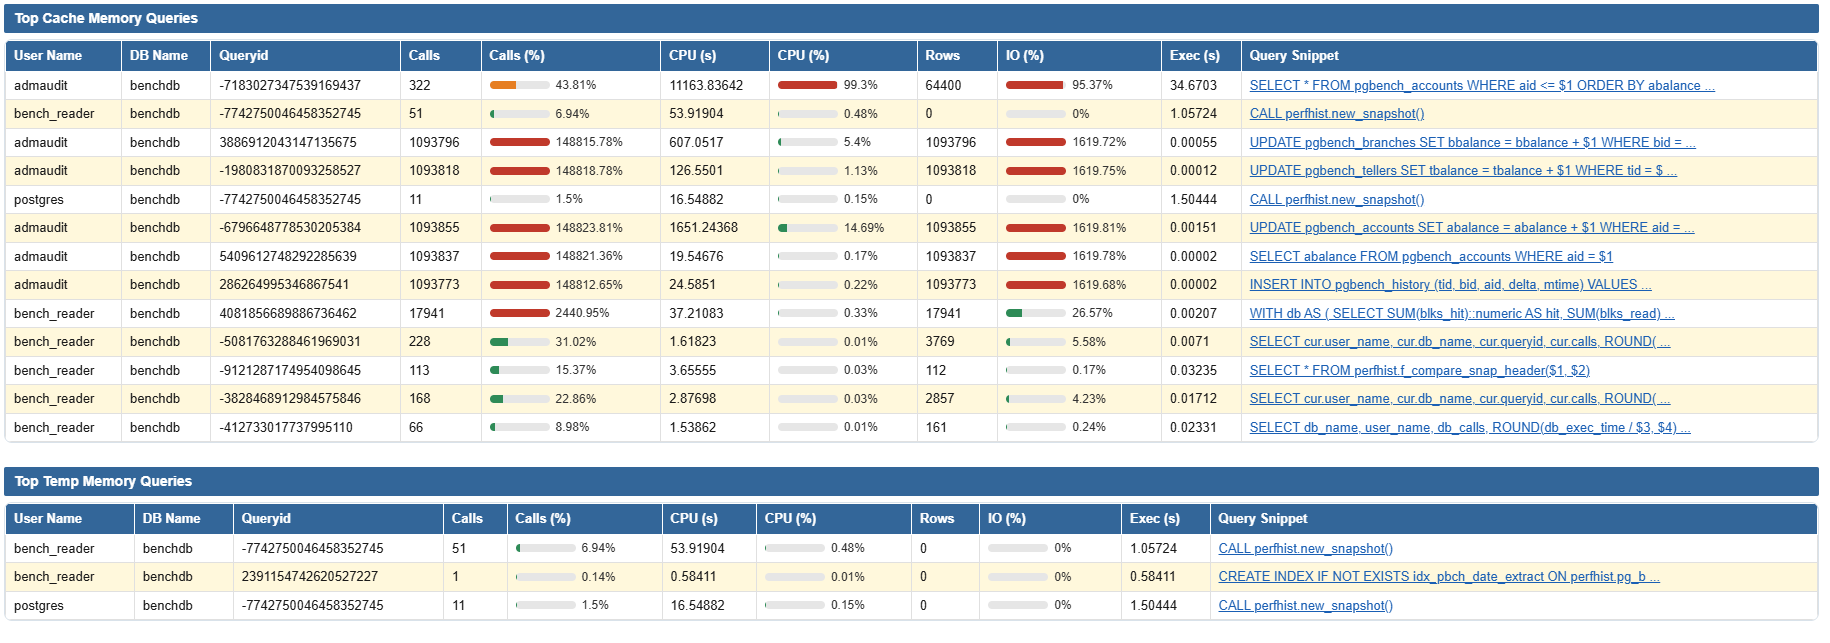
Another important part of a PostgreSQL performance audit concerns memory: shared buffers, cache hit ratio, work_mem, temporary disk usage, disk sorting, hash join spilling, volume of in-memory data.
When the cache is effective, PostgreSQL reads from disk less often and response times are better. If the report shows a lot of physical reads or temporary data, this can reveal insufficient memory allocated to queries, oversized sorts, heavy joins, or a work_mem configuration that's too low.
Reading waits in a PostgreSQL PWR report
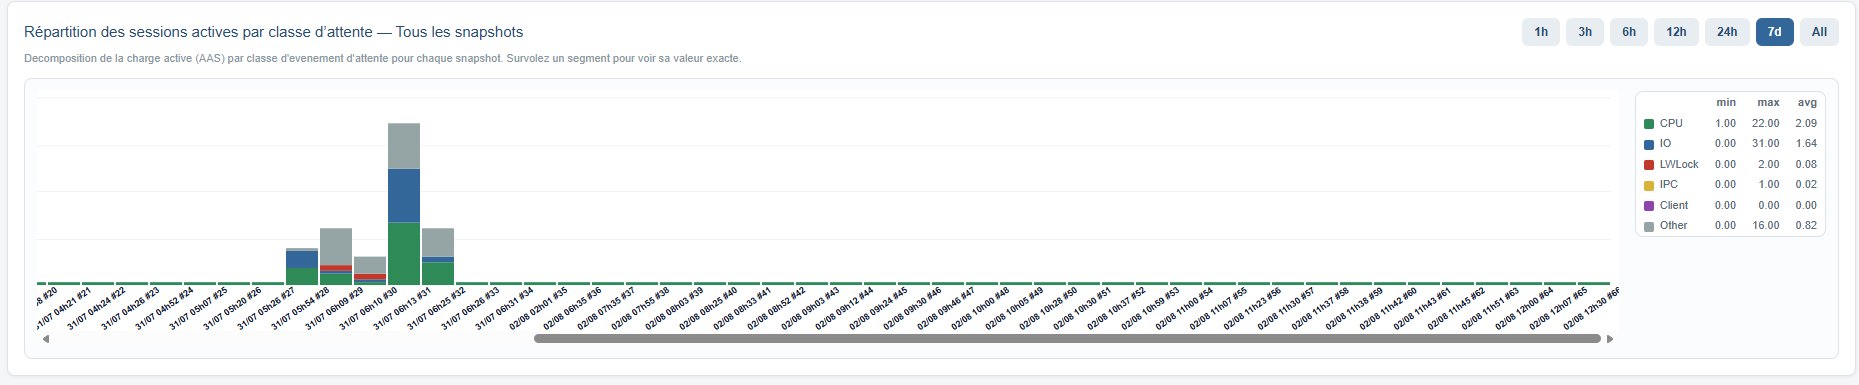
PostgreSQL wait events help you understand where time is being lost. Common wait types: CPU, I/O, lock, WAL, checkpoint, network, client, buffer, synchronization.
- Dominant CPU wait: queries too complex, too much computation, lack of CPU
- Dominant I/O wait: disk problem, missing index, insufficient cache
- Dominant lock wait: contention between sessions
- WAL / checkpoint wait: pressure on writing and on journaling
- Client / network wait: slowness on the application or network side
Examining PostgreSQL performance trends
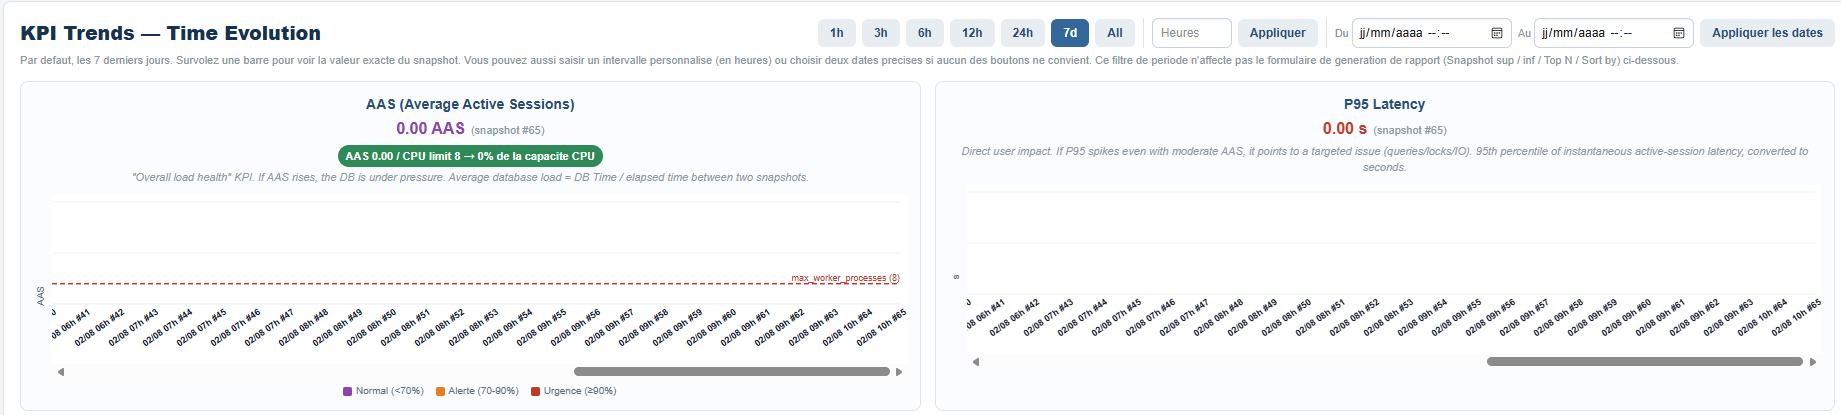
A good PostgreSQL performance analysis report shouldn't be read only at a single point in time. It should also be compared over time: evolution of total time, growth in the number of calls, evolution of physical reads, appearance of new expensive queries, changes in behavior after a deployment.
A gradual degradation can indicate growing data volumes, query drift, a loss of indexing efficiency, logical fragmentation, or a regression after an application release.
How to prioritize PostgreSQL tuning actions
Once the PWR report has been read, you need to know what to do first.
- Priority 1 — Most expensive queries: analyze the execution plan, add or fix indexes, rewrite joins, reduce unnecessary scans
- Priority 2 — Blocking and locks: shorten transactions, avoid long operations at peak times, fix access conflicts
- Priority 3 — Disk I/O: check storage, reduce physical reads, improve selectivity, limit large temporary sorts
- Priority 4 — Memory: adjust work_mem, check for hashes and sorts spilling to disk, monitor caches
- Priority 5 — Infrastructure: CPU, RAM, disk, network latency, system configuration
Quick-reading checklist for a PostgreSQL PWR report
Questions to systematically ask yourself when reading a PWR report:
- Which query dominates the total time?
- Are there excessive physical reads?
- Does the problem come from CPU, disk or locks?
- Are sessions blocked?
- Is the cache effective?
- Is there a regression compared to the previous report?
- Do the waits indicate contention or saturation?
- Is the database suffering from a structural or a one-off problem?
Conclusion
Knowing how to read a PWR report in PostgreSQL is essential for any DBA, support or development team that wants a reliable PostgreSQL diagnosis. A good PostgreSQL performance report lets you quickly spot expensive queries, PostgreSQL locks, disk I/O issues, and configuration limits.
With a methodical reading of the summary, the SQL queries, the waits, the locks and the trends, it becomes much easier to identify the real source of the slowdown and launch the right PostgreSQL tuning actions. The full report used in this article's screenshots is available for download below in PDF format, for you to explore section by section yourself.
Downloadable resources