
Surveillance PostgreSQL en temps réel — requêtes lentes, locks et pg_stat_statements
Is your PostgreSQL database slowing down or becoming unpredictable?
PWR automatically identifies the real cause and shows you how to fix it.
Performance Snapshot (Preview)
Workload Snapshot - Real-time Pulse
AAS Trend
Latency Pulse
DB Time Evolution
Free demo, no signup required.
Compatible with all your PostgreSQL environments:
Why PWR?
Latency, slow queries, locks, CPU/IO saturation: PWR automatically detects what slows your database down, minute by minute, catching weak signals before they become silent incidents.
- Automatic detection of PostgreSQL slowdowns
- Real root-cause analysis: slow queries, locks, CPU/IO
- Configuration recommendations based on your actual workload
- Minute-by-minute analysis to prevent silent incidents

Atef Riahi
Oracle & PostgreSQL DBA Expert · Performance, Migration, Cloud · 16+ years of expertise
Former consultant at Société Générale. PWR is inspired by Oracle AWR, built to fill the gap for an equivalent tool on PostgreSQL.
View LinkedIn profileLive
Instantly understand what slows your database down.
PWR analyzes your workload in real time and identifies the causes.
The overall health score of your PostgreSQL database
Key metrics in real time
What every report reveals
Identify what causes load or latency
See how your users are affected
Know when your resources are close to their limits
PWR Report – Inspired by AWR
LiveEnterprise Performance Report
Compare snapshots and detect what changed
Compare two snapshots to quickly spot cost spikes, workload shifts, and root-cause signals.
Real incident detected by PWR
Incident: transaction blocking + explicit locks
- 2 blocking sessions (session-lock-wait, idle-in-transaction)
- 3 explicit locks (granted=false)
Root cause: open transactions left behind + unindexed wide scans
Result: blocking cleared and response times stabilized
Plans available
- Free demo — Try PWR instantly
- Pro plan — For teams with multiple databases
- Enterprise plan — For large organizations
Not ready to launch the demo yet?
Get a sample PWR report by email.
Full PostgreSQL monitoring presentation
Explore the detailed PostgreSQL monitoring walkthrough: minute-by-minute detection, automatic tuning, index analysis, before/after snapshots and recommendations based on your actual workload.
System Tuning Advisor — Automatic PostgreSQL optimization
Is your PostgreSQL configuration optimal?
System Tuning Advisor analyzes your actual workload and recommends the settings that speed up your queries.
Smart recommendations
Automatically proposed from your actual activity.
Severity & confidence
Each recommendation shows its importance and reliability level.
Parameters analyzed: shared_buffers · work_mem · effective_cache_size · max_connections · maintenance_work_mem · random_page_cost · wal_buffers
Estimated global impact
Results based on realistic load scenarios (pgbench, simulated workloads) reproducing common CPU/IO contention and slow-query cases.
Recommendations based on your database's actual workload
Simplified extract from the System Tuning Advisor report.
Global tuning score
Critical
0
High
0
Medium
3
Low
4
work_memOccasional temporary files: increasing work_mem reduces disk-based sorts.
Current value
1.71MB
Recommended value
16MB
Trend
Moderate — occasional disk use
Configuration history
Pgtune · RAM / CPU
Risk index
30 / 100
effective_cache_sizeThe cache declared to the planner is undersized for the available memory.
Current value
192MB
Recommended value
6144MB
Trend
Planner decisions to optimize
Configuration history
Pgtune · RAM / CPU
Risk index
30 / 100
Optimize PostgreSQL in two steps: system configuration and table structure.
Index Tuning Advisor — Table & Index Analysis
Are your queries slow? Index Tuning Advisor detects missing indexes, sequential scans and problematic tables.
Read the in-depth article on the Index Tuning AdvisorWhat the tool analyzes
- seq_scan / idx_scan ratio
- Table volume
- Dead tuples
- Activity (insert / update / delete)
- Maintenance (VACUUM / autovacuum)
- Global score per table
Also included
- Interactive simulator: 5 typical database profiles (light, large, very active…) to try without any connection.
- Automatic final summary: detected problems, top 3 queries to fix and prioritized actions.
- One-click export: optimization plan (Markdown) and full diagnostic (JSON).
What you gain
- Fewer sequential scans
- Better index usage
- More stable tables
- Faster queries
- Lower saturation risks
Table diagnostic preview
Real example: this table needs priority action — here's why.
sales.orders
F1
40
seq / idx
F2
20
volume
F5
10
vacuum
→ Priority: reduce sequential scans and review indexes on filtered columns.
Detect → Diagnose → Optimize
The complete PostgreSQL workflow, with no wasted time.
Detect slowdowns before users feel them
- AAS, TPS, locks, and weak-signal spikes
- Real-time PostgreSQL anomaly detection
- Live health scoring to surface drift early
- Early-warning signals before impact grows
Diagnose incidents in minutes
- PWR report and root-cause diagnosis
- CPU / IO, wait events, and lock analysis
- Before/after comparison across snapshots
- Prioritized investigation with historical context
- Clear support for DBA and SRE investigations
Automatic PostgreSQL tuning
- Smart recommendations based on CPU, I/O, temp_files, and load spikes
- Severity, confidence score, and technical rationale for each change
- Measured impact on TPS, latency, and I/O before production changes
- Tuning guidance focused on shared_buffers, work_mem, and cache sizing
PWR analyzes your database every minute to detect early warning signs before they turn into incidents.
Powered by an advanced health engine, PWR identifies abnormal behavior, confirms trends, and automatically triggers state transitions.
Continuous PostgreSQL monitoring
PWR provides full PostgreSQL monitoring by correlating system metrics, abnormal behavior, and weak signals to anticipate incidents.
Result : you're alerted only when it matters, with no noise, no false positives, and a clear history of state changes.
Convinced by the approach?
Analyze a demo PostgreSQL databaseWhy PostgreSQL needs dedicated monitoring (pg_stat_statements, locks, slow queries)
PostgreSQL monitoring and performance: why wait events and slow queries often slip past classic tools.
No native AWR
PostgreSQL has no native AWR. DBAs have to combine several system views just to understand the real workload.
pg_stat_statements' limits
pg_stat_statements is powerful but limited. It doesn't show locks, wait events, or minute-by-minute trends.
Incomplete dashboards
Classic dashboards don't show root causes. They display metrics, not the origin of the slowdown.
Silent incidents
PostgreSQL incidents are often silent before turning critical. A slow query or a lock can go unnoticed until it hits your users.
A health engine is needed
DBA, SRE, and DevOps teams need a tool that detects weak signals. PWR analyzes your database every minute to anticipate incidents.
Dedicated PostgreSQL monitoring
PostgreSQL requires specialized monitoring able to correlate slow queries, locks, wait events, and system metrics. PWR reconstructs the real workload minute by minute and delivers reliable visibility, even during silent incidents.
Real-time view, trends, and history of slow queries and wait events
Current state, evolution over time, and snapshot comparison to quickly identify the root cause of incidents.
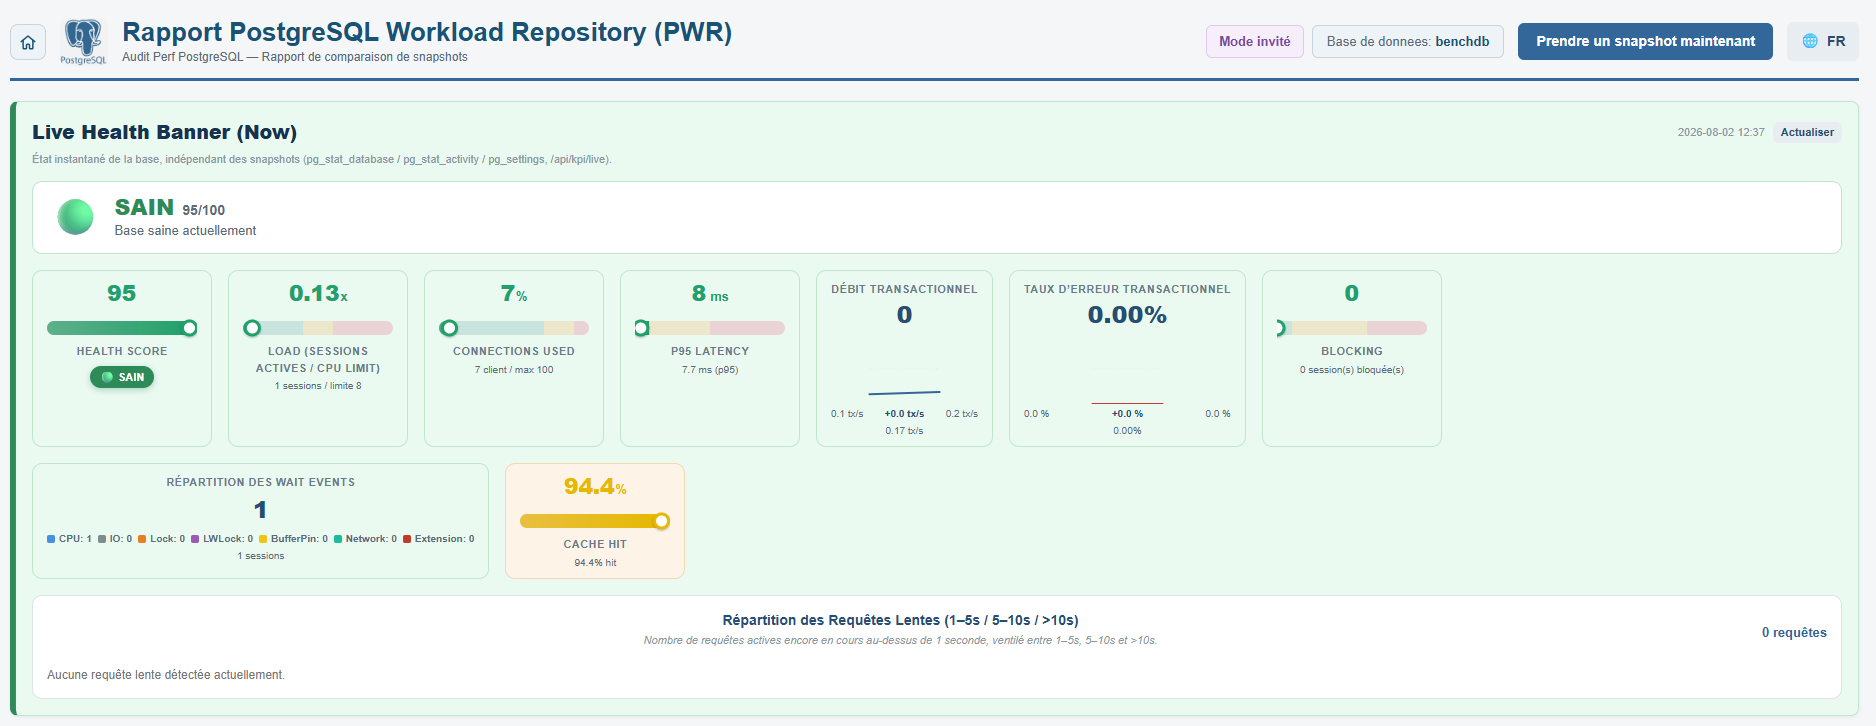
Live Health Banner
Immediate view of the current state.
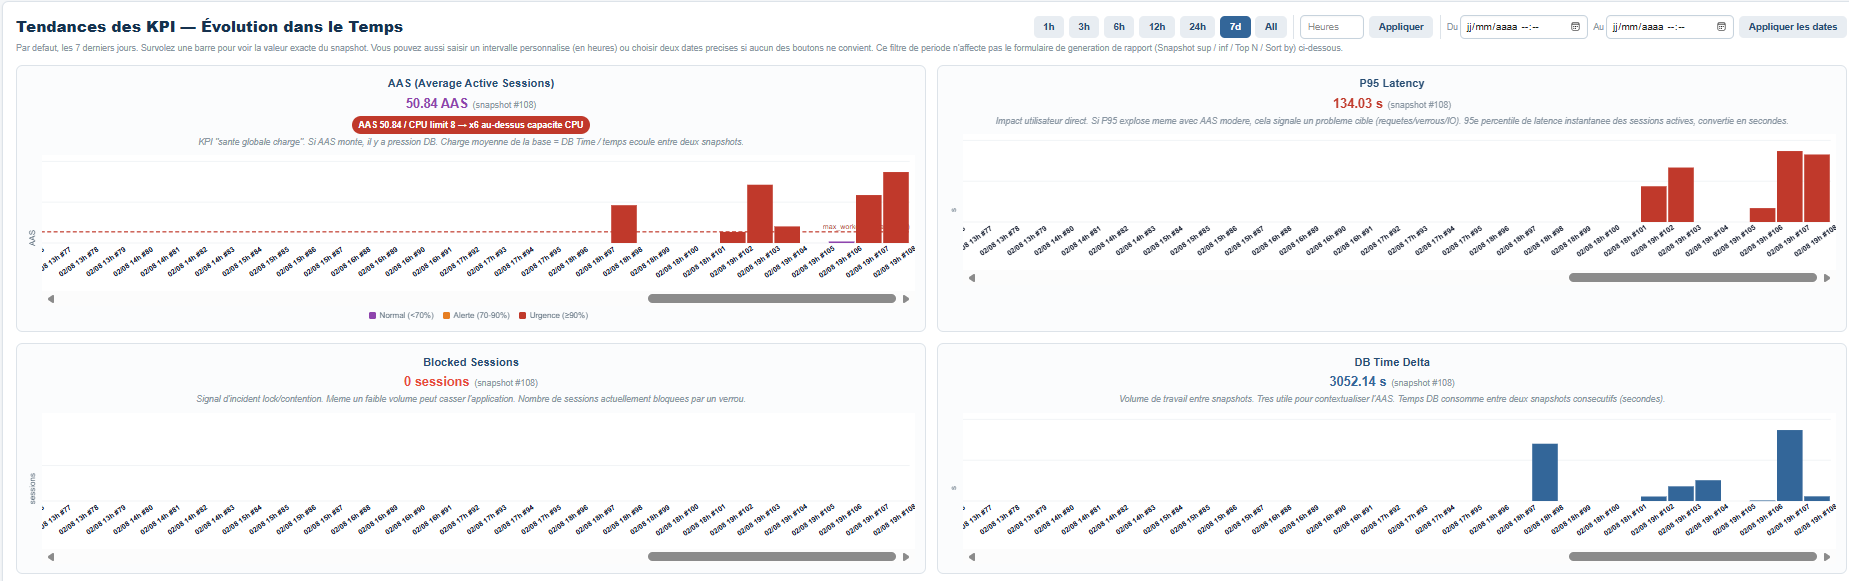
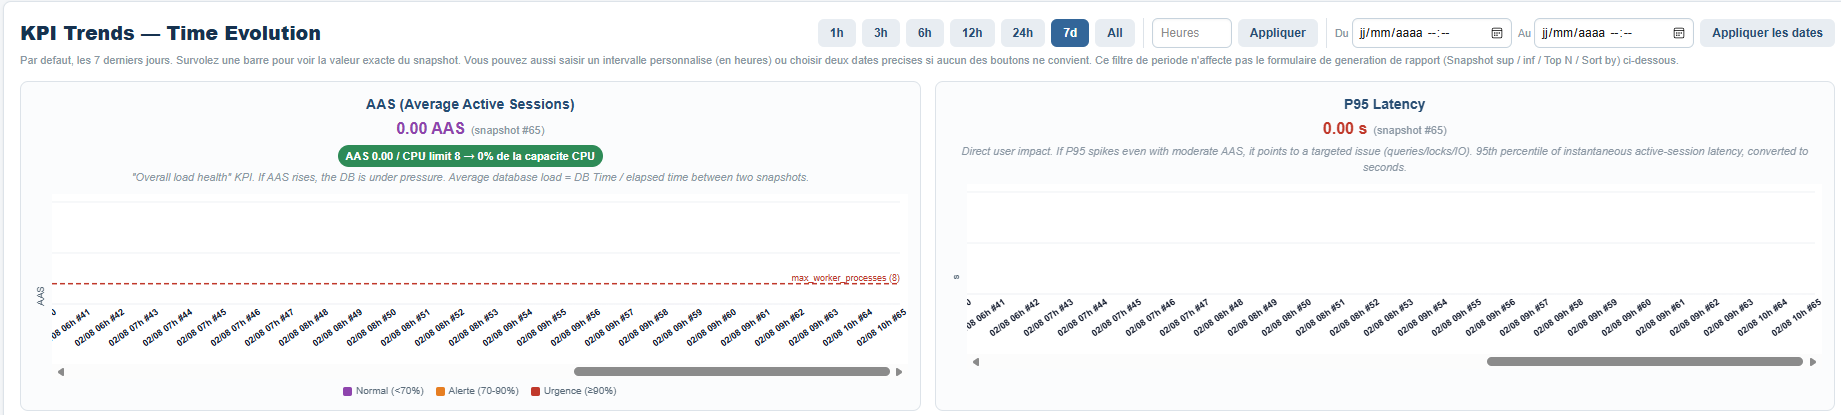
KPI overview across multiple snapshots
Track how metrics evolve over time.
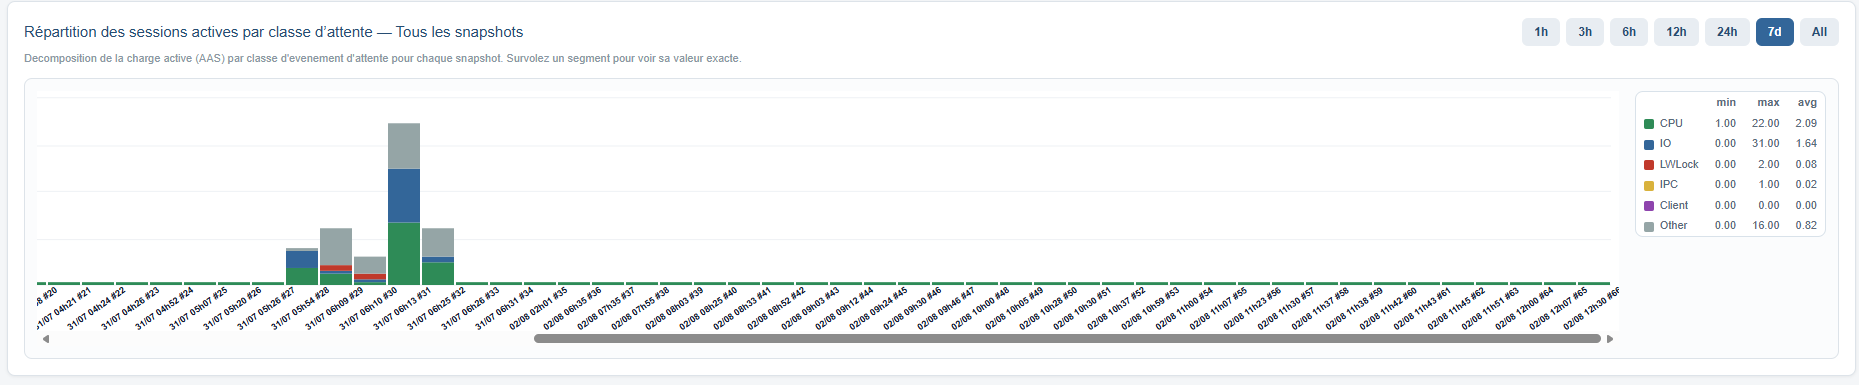
PWR Report
Analyze the differences between two snapshots.
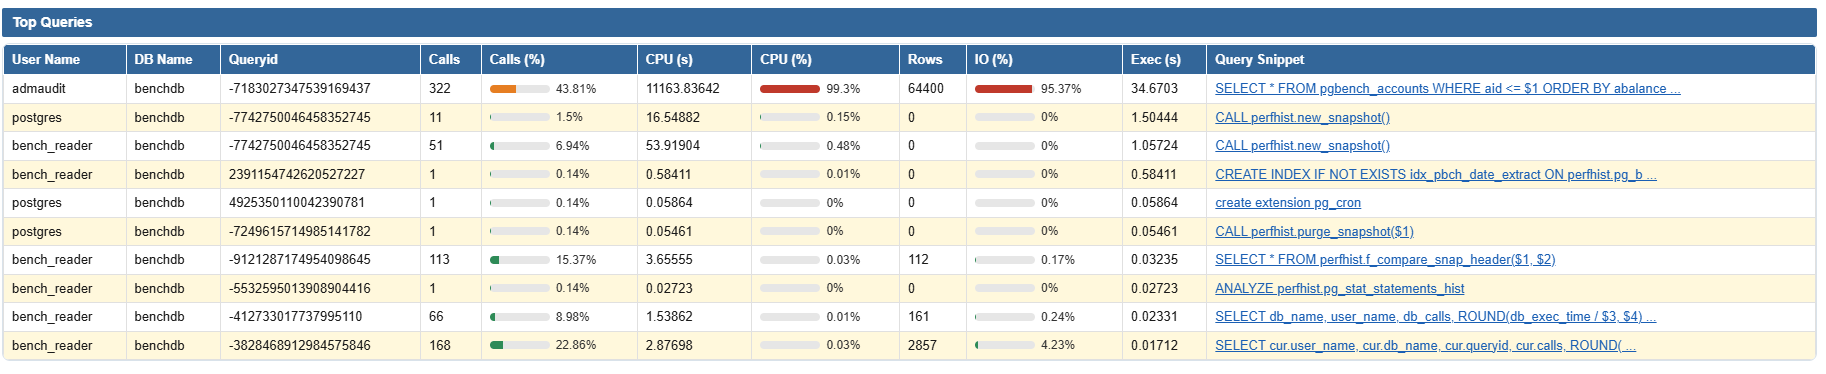
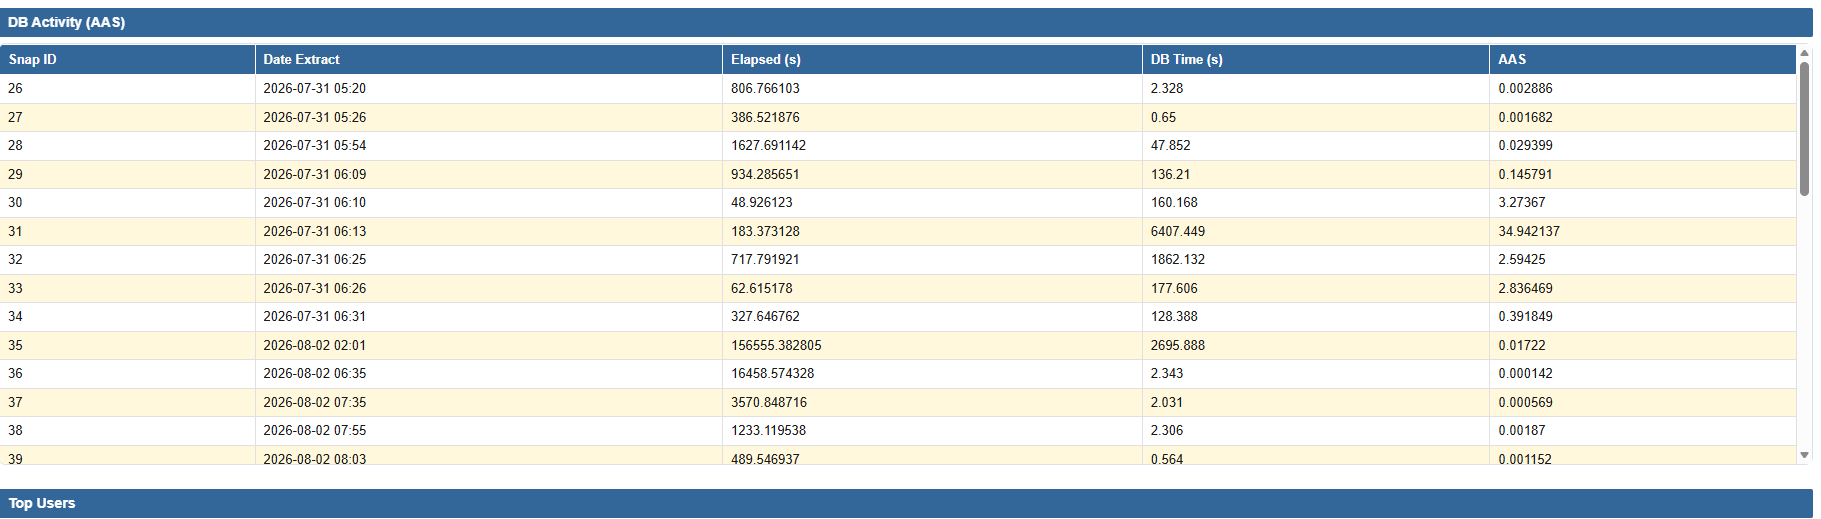
PostgreSQL analysis: snapshots, before/after comparison, PWR report
A clear PostgreSQL dashboard for slow queries, lock waits, wait events, and CPU or I/O pressure.
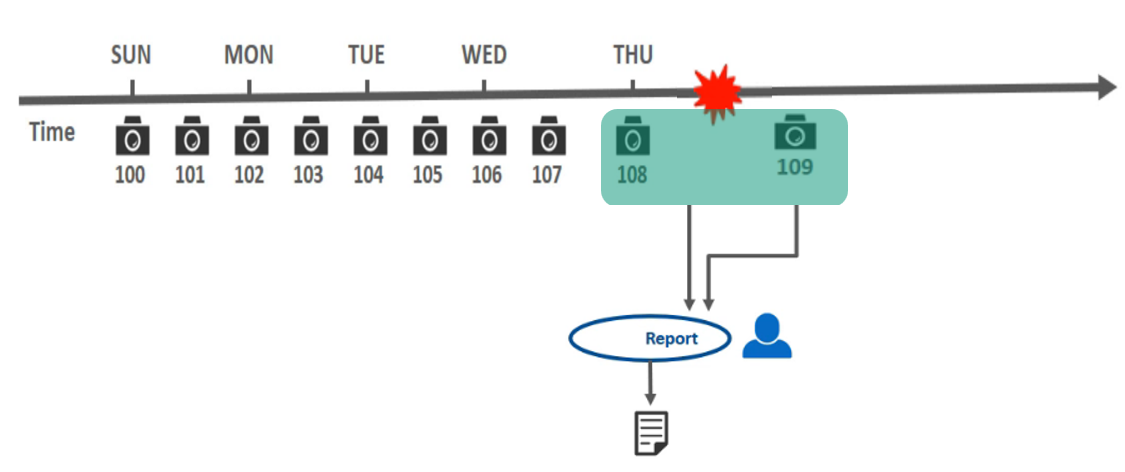
Capture snapshots
Lightweight, automated snapshots to track PostgreSQL workload without disrupting your environment.
Compare two points in time
Pick a before/after pair - deployment, incident, or slow period - and PWR computes the delta across key metrics.
Generate a readable report
Get a root-cause report ready to share with DBA, DevOps and SRE teams.
How to read a PostgreSQL PWR report: costly queries, locks, disk I/O and wait events
Turn signals into action
Clear, fast, actionable PostgreSQL diagnostics
Analyze your database in 3 steps, compare the impact, and prioritize critical actions.
1. Isolate the real cause
Immediately identify locks, slow queries, CPU/IO saturation, and wait events.
2. Compare before / after
See how latency, active sessions, TPS, and overall load evolve.
3. Prioritize actions
Rank incidents by real impact, risk, and urgency so you can respond effectively.
Expert PostgreSQL support, available 24/7
We provide free guidance on:
- PostgreSQL architecture
- Failover / HA
- PgBouncer / pgpool
- Security / GDPR
- Replicas / streaming
- PostgreSQL upgrades
Resources
Go further
Three guides to get started, understand the PWR report, and see a real incident diagnosis.
Getting started: installing PWR step by step
The concrete installation guide: required PostgreSQL extensions, creating the perfhist schema, the two connection modes (Direct or Agent), the Collector ↔ SaaS flow, and the full collector installation at the client site.
The PWR report explained in detail: PostgreSQL's AWR, section by section
A complete guided tour of the PWR report (the AWR equivalent for PostgreSQL): live banner, snapshot comparison, KPI trends, costly queries, per-query history, locks and automatic recommendations.
How PWR detects a lock in PostgreSQL
ASH analysis, snapshots, explicit locks and transactional blocking: a real PostgreSQL lock case, from the reproduction scenario to PWR's LOCK-LEVEL and SESSION-LEVEL detection, through to the automatic recommendations.
FAQ
Everything you need to know about PostgreSQL performance monitoring and root cause analysis with PWR.
What is PWR?
PWR (PostgreSQL Workload Repository) is a PostgreSQL monitoring tool built for DBA, DevOps, SRE and operations teams. It captures lightweight snapshots and helps you find the root cause of slow queries, locks and other PostgreSQL incidents in minutes.
Is PWR read-only and production-safe?
Yes. PWR is designed for safe use in production. It relies on a dedicated schema for its own technical writes (metadata, snapshots), while the application user used for collection only has read access to the PostgreSQL catalogs required for observability. The product also includes purge mechanisms to control disk usage, with a configurable capture frequency and retention period so you can limit load and data volume on your database.
Is access secure and reversible?
Yes. PWR uses customer-controlled, read-only access to a dedicated schema created just for its own objects - it never writes to your application tables. You can revoke access or purge/drop everything at any time.
Does my data leave my infrastructure?
Your data stays hosted on your own infrastructure. PWR runs against your PostgreSQL environment, and depending on your security requirements, you can choose either deployment mode. You keep control over access and data retention.
What's the difference between the demo and the trial?
The demo lets you discover the product for free. The trial gives you full access for 15 days (credit card required).
Is the trial really free?
Yes, the trial is free for 15 days. A credit card is required at signup.
Start your first PostgreSQL report in minutes
No signup, no credit card. See a real PWR report on a sample PostgreSQL workload now.
On the call, ask us anything about:
Book a free 15-minute call so we can answer all your questions (architecture, failover, versioning, proxy, production impact, installing on a replica...), then get PWR running together on your PostgreSQL database.