
How PWR detects a lock in PostgreSQL
10 min read
ASH analysis, snapshots, explicit locks and transactional blocking: a real PostgreSQL lock case, from the reproduction scenario to PWR's LOCK-LEVEL and SESSION-LEVEL detection, through to the automatic recommendations.
Introduction: when a lock becomes critical
When a PostgreSQL system starts to slow down, the symptoms are often visible in the global metrics well before a precise cause is identified: high AAS (Average Active Sessions), extreme P95 latency, blocked sessions, wait events dominated by IO, and CPU saturated or close to its limit.
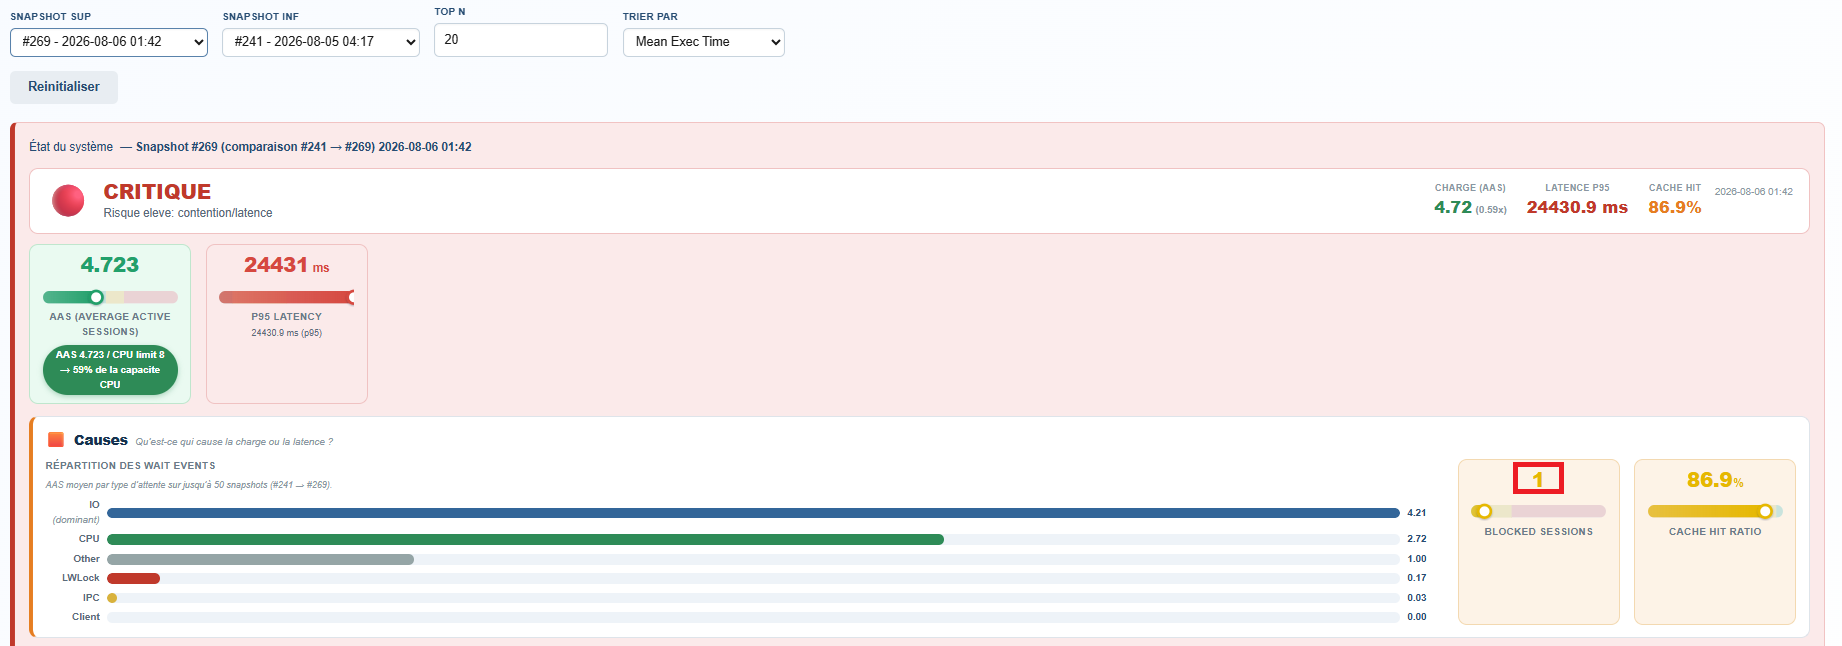
In the real case analyzed by PWR below, AAS reaches 4.72, P95 latency climbs to 24,430 ms, the CPU limit is 8 (used at 59%), one session is blocked, and the dominant wait events are IO and CPU. This kind of profile is typical of a lock that was never released or a transaction left open too long.
PWR automatically detects these blockages through ASH (Active Session History) analysis and regular activity snapshots — with no manual configuration required.
Reproducing a PostgreSQL lock: test scenario
To concretely understand how PWR identifies a lock, here is a simple, repeatable scenario on a dedicated test table.
CREATE TABLE public.lock_test (
  id bigserial PRIMARY KEY,
  name text NOT NULL,
  value int NOT NULL DEFAULT 0,
  updated_at timestamptz NOT NULL DEFAULT now()
);

INSERT INTO public.lock_test (name, value)
VALUES ('row-1', 10);
Simulating a lock with two sessions
Step 2 is to open two psql sessions in parallel. Session A takes a lock and doesn't release it: it starts a transaction, updates the row id = 1, then stays open with neither COMMIT nor ROLLBACK. PostgreSQL then places a ROW EXCLUSIVE lock on that row, active as long as the transaction isn't finished.
Session B then tries to modify the same row. Without lock_timeout, it waits indefinitely for session A to release the lock. With a lock_timeout of, say, 10 seconds, it receives an explicit error after that delay instead of blocking without limit.
BEGIN;
UPDATE public.lock_test
SET value = value + 1, updated_at = now()
WHERE id = 1;
-- We keep the transaction open, with neither COMMIT nor ROLLBACKBEGIN;
SET lock_timeout = '10s'; -- optional
UPDATE public.lock_test
SET value = value + 5, updated_at = now()
WHERE id = 1;How does PWR detect a lock?
PWR continuously analyzes several sources: pg_locks, pg_stat_activity, the pg_blocking_pids() function, ASH snapshots, deltas computed between two snapshots, as well as session states such as idle in transaction or session-lock-wait.
It distinguishes two categories of blocking, since they have neither the same symptoms nor the same impact: LOCK-LEVEL blocking, corresponding to explicit locks visible in pg_locks, and SESSION-LEVEL blocking, corresponding to transactions left open too long or waits invisible to classic locks but very real in pg_stat_activity.
LOCK-LEVEL blocking: explicit locks (pg_locks)
LOCK-LEVEL blocking is what's visible in pg_locks: a row with granted = false, on a relation, tuple, page or transactionid, with a mode such as ShareLock, ExclusiveLock, etc.
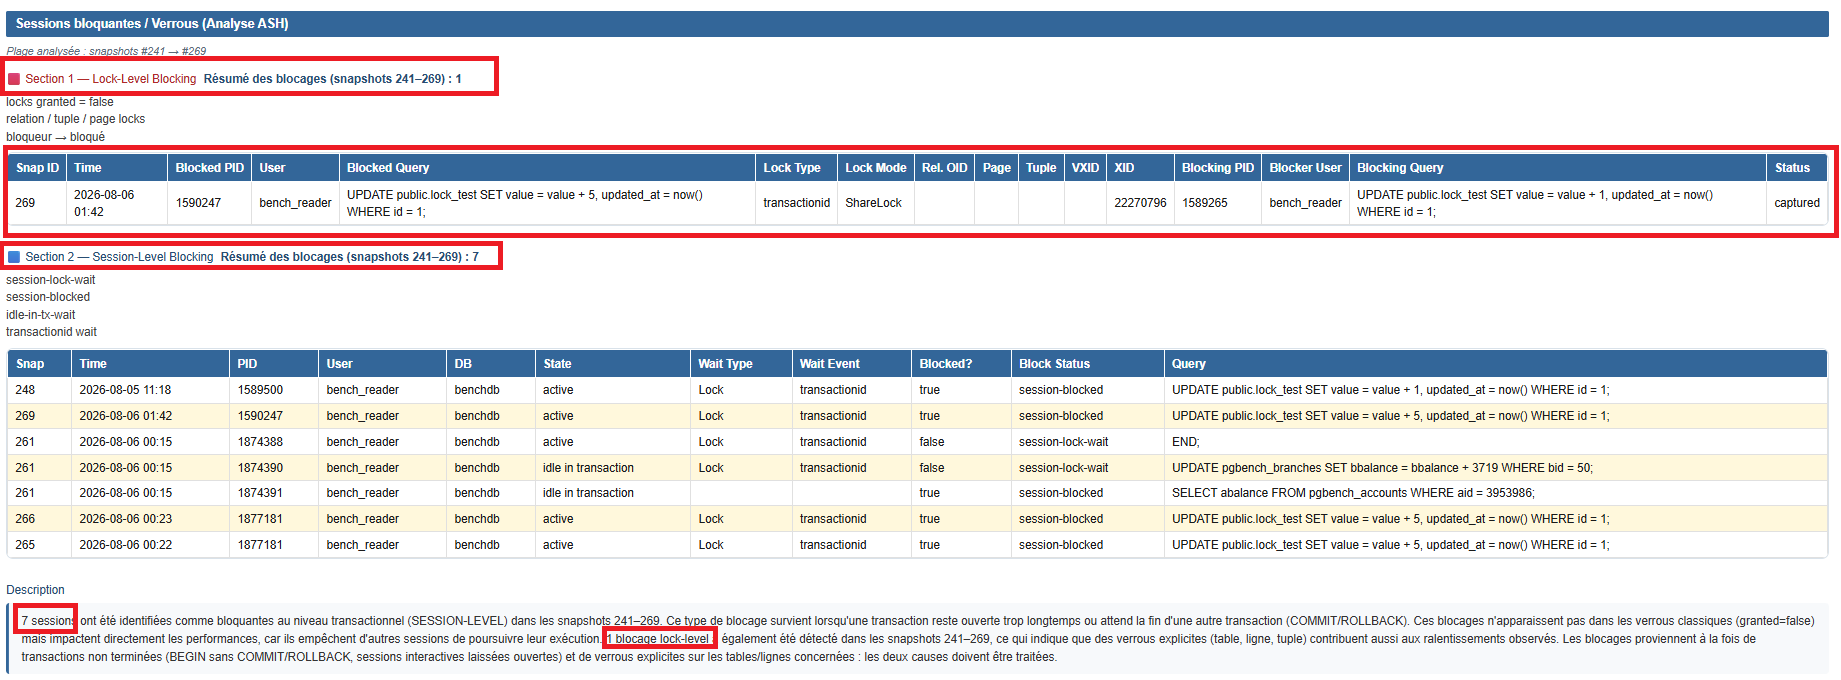
In the real case detected by PWR (snapshots 241 to 269), an explicit lock is identified: type transactionid, mode ShareLock, blocked PID 1590247, blocking PID 1589265. The blocked query is UPDATE public.lock_test SET value = value + 5 ..., and the blocking query is UPDATE public.lock_test SET value = value + 1 .... PWR shows this lock in its LOCK-LEVEL Blocking section.
SESSION-LEVEL blocking: transactional blocking invisible in pg_locks
SESSION-LEVEL blocking is invisible in pg_locks but very visible in the ASH: it shows up as states like session-lock-wait, session-blocked, idle-in-transaction or idle-in-tx-wait, sometimes also associated with a transactionid.
In the same real case (snapshots 241 to 269), PWR detects 7 blocking sessions, with observed states session-lock-wait, idle-in-transaction and session-blocked. The queries involved include UPDATE public.lock_test SET value = value + 1 ..., UPDATE public.lock_test SET value = value + 5 ..., a simple END;, as well as application queries like UPDATE pgbench_branches ... and SELECT abalance FROM pgbench_accounts .... These blockages don't show up in any classic lock, but directly impact database performance.
Why does PWR detect both types of blocking?
Because both cause slowdowns, but for different reasons. LOCK-LEVEL blocking corresponds to explicit locks: direct contention on a table or row, resolved as soon as the blocking transaction ends.
SESSION-LEVEL blocking corresponds to transactions left open too long: blockages invisible in classic locks, but just as critical since they hold on to resources and block other sessions without any explicit lock appearing. PWR combines both to give a complete picture of the real contention on the database.
Recommendations generated by PWR
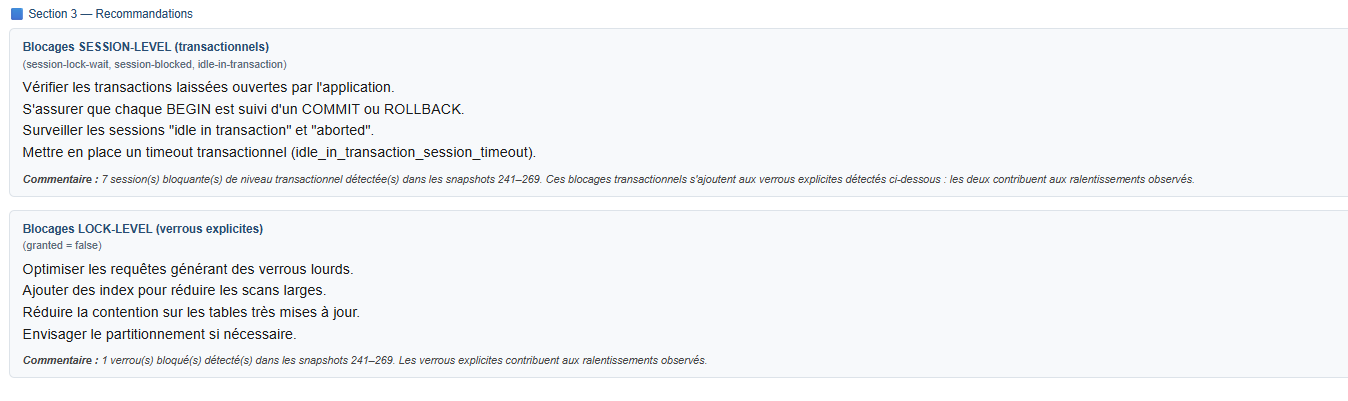
For SESSION-LEVEL (transactional) blocking, PWR recommends checking for transactions left open, making sure every BEGIN is properly followed by a COMMIT or a ROLLBACK, monitoring idle-in-transaction sessions, and enabling idle_in_transaction_session_timeout to automatically cut off abandoned transactions. On the case analyzed, the generated comment is: "7 blocking session(s) detected in snapshots 241–269".
For LOCK-LEVEL (explicit) blocking, PWR recommends optimizing the queries that generate heavy locks, adding indexes to reduce wide scans, reducing contention on heavily updated tables, and considering partitioning if contention persists. On the case analyzed, the generated comment is: "1 blocked lock detected in snapshots 241–269".
Summary: how PWR detects a lock
PWR detects a lock by continuously combining several sources: explicit locks from pg_locks, transactional blocking from pg_stat_activity, ASH snapshots, deltas computed between two snapshots, and session states like idle in transaction or session-lock-wait.
It systematically distinguishes two categories — LOCK-LEVEL for explicit locks, SESSION-LEVEL for open transactions or invisible waits — and provides, for each, a complete diagnosis, a summary of the blocking detected, and actionable recommendations rather than a simple list of raw metrics.