
Live Health Banner: precise definition of every real-time indicator
9 min read
Load, Connections Used, P95 Latency, transactional throughput and error rate, blocked sessions, wait events, cache hit, slow queries: exactly what each Live Health Banner indicator measures, its color thresholds and its weight in the Health Score.
The Live Health Banner: a snapshot-independent instant view
Unlike the rest of the PWR report (based on comparing two historized snapshots), the Live Health Banner shows the database's state right now, recomputed on every refresh from pg_stat_database, pg_stat_activity and pg_settings via the /api/kpi/live endpoint. It's the first block to check to know whether the database is doing well right now, even before running a snapshot comparison.
At the top of the banner, an overall Health Score (0 to 100) summarizes the state of 5 weighted sub-metrics: Load (30%), Blocking / blocked sessions (25%), Connections Used (20%), P95 Latency (15%) and Cache Hit (10%). Each sub-metric now receives a continuous sub-score from 0 to 100, obtained by linear interpolation between its "green" threshold (100 points) and its "red" threshold (0 points) detailed below for each indicator — two close values sitting on either side of the same threshold (e.g. a P95 of 19 ms vs 21 ms) thus produce similar sub-scores, instead of jumping abruptly from one tier to the next as with a simple green/orange/red classification. The sub-scores are then combined according to their weight. If a metric is unavailable (e.g. p95 not computable for lack of an active query), it is simply excluded and the remaining weights are proportionally rebalanced, so the score stays representative even with partial data.
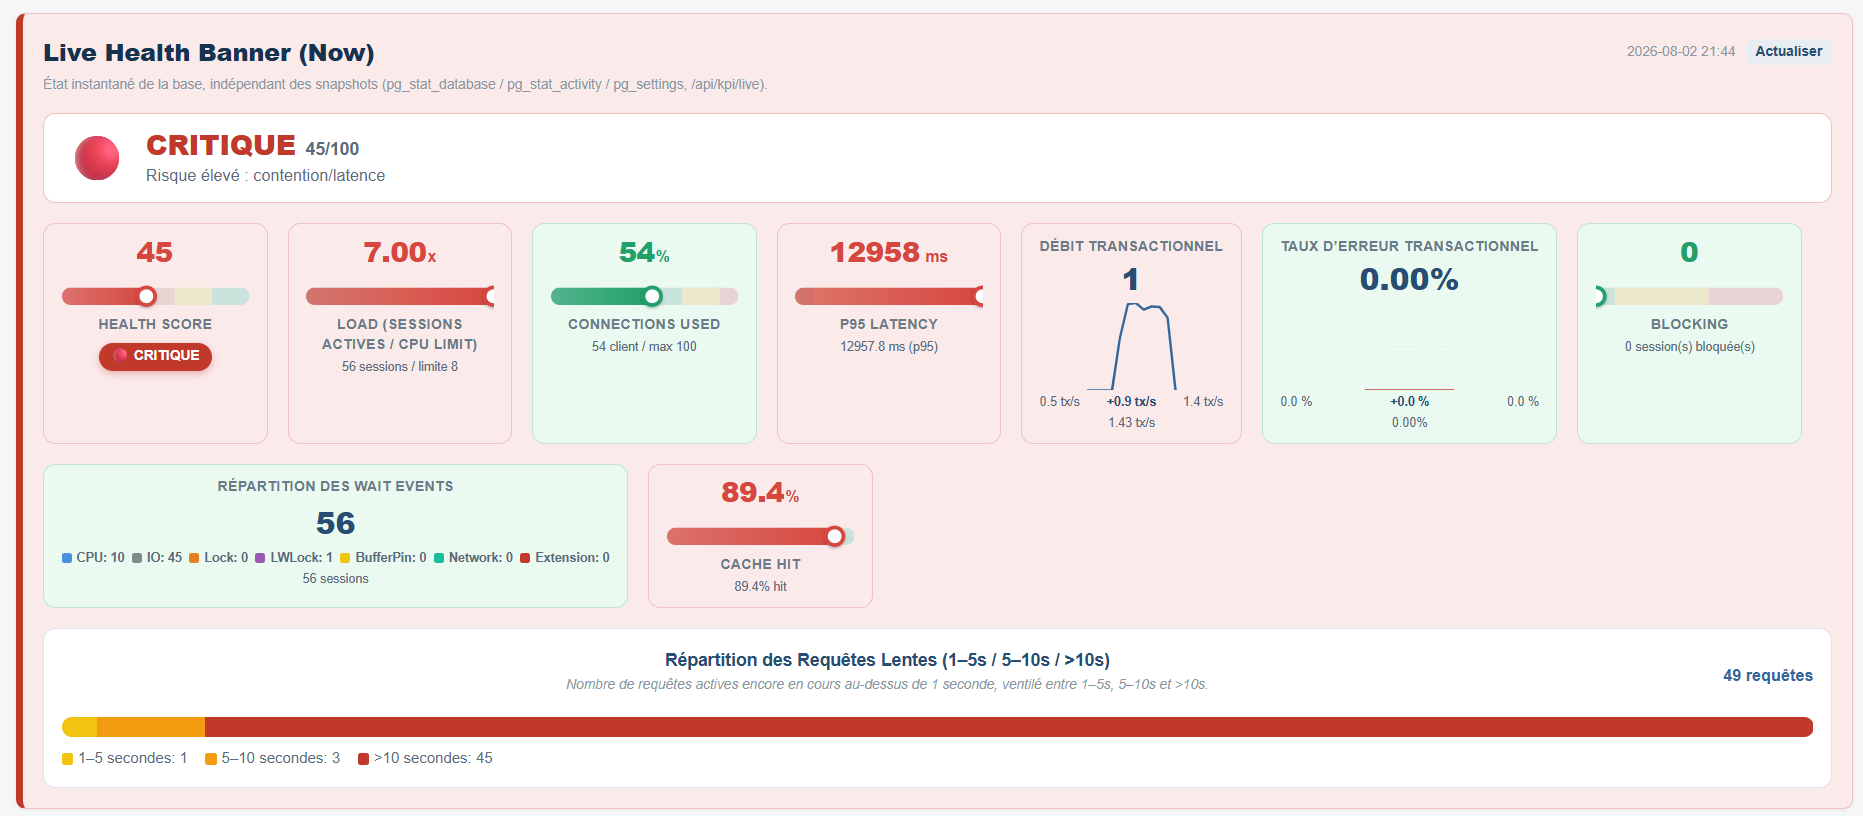
The resulting score is then translated into a severity badge: HEALTHY (score ≥ 80, green, "the database is healthy"), WARNING (60 to 79, orange, "attention required") or CRITICAL (< 60, red, "urgent intervention"). In the screenshot below, the score is 45/100 (CRITICAL), pulled down by a P95 Latency of 12958 ms and many active queries exceeding 10 seconds.
Load (Active sessions / CPU limit)
This indicator relates the number of sessions active right now (active_sessions, i.e. connections whose pg_stat_activity state is 'active') to a reference limit called CPU limit in the interface: in practice the value of the PostgreSQL max_worker_processes setting, used as an approximate ceiling of parallelism the instance can sustain without saturating its processors.
The resulting ratio (active sessions ÷ CPU limit) is shown as an "x" value (e.g. 7.00x means 7 times the reference limit). For the badge display, it turns red above 1.2x, orange between 0.8x and 1.2x, and stays green below 0.8x; for the Health Score, these same two bounds (green 0.8x, red 1.2x) serve as anchors for a continuous interpolation, so that a 1.0x ratio weighs less than a 1.2x ratio instead of being classified the same way as long as it stays under 1.2x. In the example (56 active sessions / limit 8), the 7.00x ratio, far beyond the red threshold, alone explains a large part of the overall CRITICAL score: the database is handling far more active sessions in parallel than its configuration is meant to absorb efficiently.
Connections Used
This percentage measures the pressure on the client connection pool: the current number of client connections (client_conn, excluding internal processes like autovacuum or the wal writer) related to max_connections, the ceiling configured on the PostgreSQL side (client_conn_used_pct in the API).
The color thresholds are: red above 90%, orange between 70% and 90%, green below 70%. These same two bounds (green 70%, red 90%) also serve as anchors for the continuous interpolation used for the sub-score feeding into the Health Score. In the example, 54% (54 clients / max 100) stays in the green zone — pressure on this specific point is therefore not the cause of the problem observed elsewhere.
P95 Latency
The instant P95 Latency is the 95th percentile of the time already elapsed (in milliseconds) for currently active queries (query_start until now) — not to be confused with a total response time once a query has finished. It answers the question: among the queries currently running, 95% of them have been running for less than how long?
Thresholds: red above 100 ms, orange between 20 and 100 ms, green below 20 ms — these same two bounds (green 20 ms, red 100 ms) also serve as anchors for the continuous interpolation used for the P95 sub-score feeding into the Health Score. In the example, 12958 ms (nearly 13 seconds) is far beyond the red threshold and therefore weighs 0 points in the score: this means a significant share of active queries are already stuck or very slow at the time of measurement, consistent with the large number of queries running over 10 seconds seen further below.
Transactional throughput (TPS)
The transactional throughput shows the number of transactions per second (tx/s) currently processed by the instance, along with a mini-chart (sparkline) showing its recent trend. It does not feed into the Health Score calculation: it is a context indicator, not a severity one.
A TPS that collapses while an incident is otherwise being flagged (high P95, many slow queries) often confirms that the slow queries are blocking overall throughput rather than simply slowing down in isolation — it's one of the first charts to cross-reference with the slow-query breakdown.
Transactional error rate
This percentage is computed from the cumulative xact_commit and xact_rollback counters in pg_stat_database: it is the share of transactions ending in a ROLLBACK rather than a COMMIT over the recent sliding window, with its own sparkline history.
This is not a measure of application-level errors in the broad sense (e.g. constraints violated on the client side before even reaching the database), but an indicator of the proportion of transactions cancelled on the PostgreSQL side. A sudden high rate often accompanies lock conflicts, deadlocks resolved by automatic rollback, or transactions explicitly cancelled by the application following timeouts.
Blocked sessions (Blocking)
This indicator counts sessions currently waiting for a lock held by another transaction (wait_event_type = 'Lock' in pg_stat_activity) — shown as "N blocked session(s)".
Badge thresholds: red above 5 blocked sessions, orange from 1, green at 0. For the Health Score, the sub-score interpolates continuously between 0 sessions (100 points) and 5 or more sessions (0 points): for example 1 blocked session already removes 20 points, 3 sessions remove 60, without waiting for the 5-session tier. This is one of the most heavily weighted metrics in the Health Score (25%) because blocked sessions have an immediate contagion effect: they themselves hold on to resources and can block others in a cascade.
Wait Event breakdown
This block breaks down, at the same instant, all active sessions by wait type (wait_event_type from pg_stat_activity): CPU (no wait_event_type set — the session is actually using the processor), IO (disk wait), Lock (waiting for an application lock), LWLock (PostgreSQL's lightweight internal lock), BufferPin, Network and Extension. The total shown is the sum of these seven categories, i.e. the total number of active sessions at that instant.
In the example (56 sessions: CPU 10, IO 45, LWLock 1), the vast majority of active sessions are waiting on IO — a strong signal to steer the diagnosis toward a disk/cache bottleneck rather than a simple CPU compute spike. This breakdown does not directly feed into the Health Score, but it explains the probable cause of the already-degraded Load and P95 sub-metrics.
Cache Hit
The cache hit ratio is the share of block reads served from the memory cache (shared_buffers, via blks_hit from pg_stat_database) rather than from disk (blks_read): 100 × blks_hit ÷ (blks_hit + blks_read).
Unlike the other gauges, its thresholds are inverted (a high value is good): green from 95%, orange between 90% and 95%, red below 90%. These same bounds (green 95%, red 90%) also feed a continuous interpolation for the Cache Hit sub-score of the Health Score, in the opposite direction of the other metrics (the higher the ratio, the higher the sub-score). In the example, 89.4% is below the red threshold and therefore weighs 0 points in the score — a ratio worth watching if the database usually serves above 95%.
Slow Query breakdown (1–5s / 5–10s / >10s)
This stacked bar counts active queries whose already-elapsed time (clock_timestamp() - query_start) exceeds 1 second, split into three buckets: 1–5 seconds (yellow), 5–10 seconds (orange) and more than 10 seconds (red). Only client connections are counted (internal processes like autovacuum are excluded). The total shown on the right is the sum of the three buckets.
Each segment of the bar now shows a tooltip on hover with the label, the exact number of queries and its percentage of the total. In the example (49 slow queries: 1 in 1-5s, 3 in 5-10s, 45 over 10 seconds), the overwhelming majority of slow queries are already past 10 seconds — a signal of blocking or active contention rather than a simple passing slowdown, consistent with the ~13-second P95 and the Health Score's CRITICAL status.