
Getting started: installing PWR step by step
15 min read
The concrete installation guide: required PostgreSQL extensions, creating the perfhist schema, the two connection modes (Direct or Agent), the Collector ↔ SaaS flow, and the full collector installation at the client site.
Downloadable resources
Prerequisites: PostgreSQL extensions
Connect to the PostgreSQL database to be monitored with a superuser account (e.g. postgres), then install the extensions below.
pg_stat_statements provides query execution statistics, and pg_buffercache provides the cache and memory indicators used in the reports.
pg_stat_statements must be added to shared_preload_libraries. You can edit postgresql.conf directly (alternative 1) or run ALTER SYSTEM as a superuser (alternative 2). Warning: ALTER SYSTEM SET replaces the existing value; if other libraries are already preloaded, keep them in the new value.
If pg_stat_statements has never been enabled on this instance before, a full restart of the PostgreSQL service is then required. A third extension, pg_cron, is optional: it is only needed if you want snapshot scheduling to be handled natively by PostgreSQL (Linux only).
shared_preload_libraries = 'pg_stat_statements'
# then restart the PostgreSQL serviceALTER SYSTEM SET shared_preload_libraries = 'pg_stat_statements';sudo systemctl restart postgresqlCREATE EXTENSION IF NOT EXISTS pg_stat_statements;
CREATE EXTENSION IF NOT EXISTS pg_buffercache;
-- optional, native scheduling (Linux):
CREATE EXTENSION IF NOT EXISTS pg_cron;Assisted installation (recommended)
To guarantee a fast, error-free installation, we offer a free 15-minute setup call during your trial period.
This call covers:
- checking the PostgreSQL configuration (extensions, shared_preload_libraries)
- validating the pwr user's permissions
- installing the perfhist schema
- choosing the connection mode (Direct or Agent)
- testing the capture of the first snapshot
- making sure the collector communicates correctly with the SaaS
Manual installation is still possible
You can follow the steps below if you prefer a self-service setup.
Step 1 — Create the monitoring user
We recommend creating a dedicated user on your PostgreSQL database for PWR monitoring.
Connect to the database to be monitored as a PostgreSQL superuser, then run the code below. Replace CHANGE_ME_STRONG_PASSWORD with a strong password of your choice and change_me_db_name with the name of the database to monitor.
This code creates the dedicated monitoring user pwr, then grants it only the rights it needs: pg_monitor to read activity and query statistics, and CONNECT/CREATE limited to the target database in order to install the perfhist schema. This user has no read or write access to your application data.
CREATE ROLE pwr WITH LOGIN PASSWORD 'CHANGE_ME_STRONG_PASSWORD';
ALTER ROLE pwr WITH CREATEROLE CREATEDB;
GRANT CONNECT, CREATE ON DATABASE change_me_db_name TO pwr;
GRANT pg_monitor TO pwr;
Verify the connection
Check that you can connect to the database with the new monitoring user:
- Keep the pwr user's username and password: they will be needed in the last step of this guide.
PGPASSWORD=CHANGE_ME_STRONG_PASSWORD psql -h localhost -d change_me_db_name -U pwrStep 1 bis — Alternative: install the schema via an interactive script (Install_schema.zip)
If you'd rather not run SQL scripts one by one, the Install_schema.zip archive (downloadable below) bundles everything needed to install perfhist with a single interactive command. Once extracted, the root Install_schema/ folder contains two sibling folders: scripts/ for the Linux/macOS and Windows installers, and Install_schema/ for every SQL script.
The file Install_schema/Install_schema/create_perfhist.sql is the main SQL script: the installers Install_schema/scripts/install.sh and Install_schema/scripts/install.bat run it automatically after asking for your connection details.
Prerequisites: an accessible PostgreSQL database, the psql client installed and available on the PATH, and a user with sufficient rights to create the schema, tables, views, functions, procedures and grants (the pwr user created in the previous step is suitable).
On Linux/macOS, make the script executable then run it; on Windows, simply run Install_schema\scripts\install.bat. In both cases, the script asks for PGHOST (default 127.0.0.1), PGPORT (default 5432), PGDATABASE, PGUSER, and PGPASSWORD (optional if you already use .pgpass or an equivalent client-side mechanism).
Once the script finishes, verify the installation with the psql commands below, and make sure a first snapshot was created if the script includes one.
Install_schema/
  scripts/
    install.bat                 # Windows
    install.sh                  # Linux / macOS
  Install_schema/
    create_perfhist.sql         # MAIN SCRIPT
other *.sql scriptschmod +x Install_schema/scripts/install.sh
./Install_schema/scripts/install.shThis is the expected result when the perfhist schema installation completes successfully:

Install_schema\scripts\install.bat\dn+ perfhist
\dt perfhist.*
\dv perfhist.*
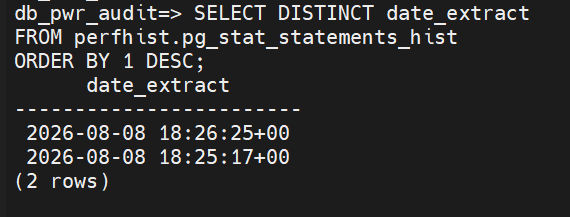
SELECT DISTINCT date_extract
FROM perfhist.pg_stat_statements_hist
ORDER BY 1 DESC;This is the expected result of the post-installation check:
Step 2 — Take a snapshot
Once installation is complete, day-to-day use no longer requires any installation script: you simply take snapshots and generate reports.
This command can be run manually or automated (cron, pg_cron, Windows Task Scheduler, Ansible, CI/CD). The more frequent the snapshots, the easier it is to replay a past incident and pinpoint its root cause.
CALL perfhist.new_snapshot();This is the expected result after creating the snapshot:

Built-in automatic capture (frequency + retention, no external cron)
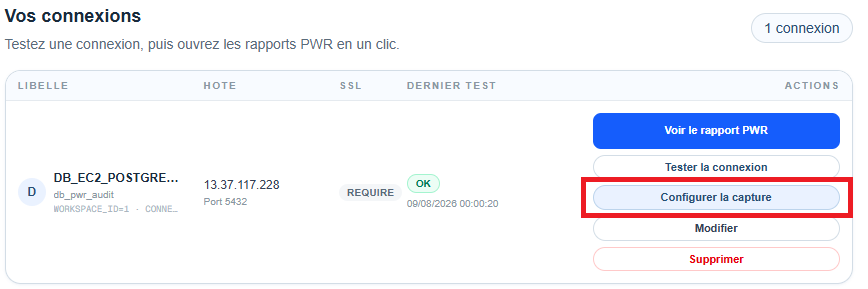
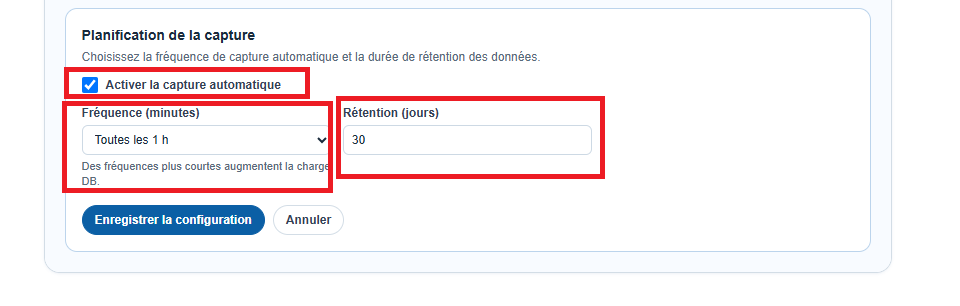
In Direct mode, you no longer need to set up an external cron job to automate your snapshots: from the "Connections" tab, the "Configure capture" button lets you choose a frequency (in minutes) and a retention period (in days), then enable automatic scheduling in one click.
On the server side, a scheduler internal to PWR checks every 30 seconds for schedules that are due, and processes each one through a strict flow: creating an execution log ("running"), connecting to your database, running CALL perfhist.new_snapshot(), computing the maximum number of snapshots to keep, then purging the oldest ones via CALL perfhist.purge_snapshot(max_snapshot). The log and the schedule are then updated (success or failure).
The number of snapshots kept (max_snapshot) is computed as follows: snapshots_per_day = floor(1440 / frequency_minutes), then max_snapshot = retention_days × snapshots_per_day (with a minimum of 1). For example, a 15-minute frequency with a 7-day retention keeps at most 672 snapshots.
If an error occurs during capture or purge (unreachable database, timeout, etc.), the run is retried once after a short delay; if the failure persists, the execution log is marked "failed" with the error message, and the schedule stays active to automatically retry on the next cycle rather than stopping silently.
1. Anti-duplicate claim (FOR UPDATE SKIP LOCKED) of due schedules
2. For each claimed schedule:
   - create a "running" execution log
   - connect to the client database
   - CALL perfhist.new_snapshot();
   - max_snapshot = retention_days * floor(1440 / interval_minutes)  -- min 1
   - CALL perfhist.purge_snapshot(max_snapshot);
   - mark the log "success"
   - update the schedule (last_run_at, next_run_at, last_status)
3. On error: log "failed" + error_message, schedule updated
   (last_status='failed', last_error, next_run_at recomputed for the
   next attempt)
Two ways to connect to your database
Once the pwr user and the perfhist schema are installed (steps above), PWR can connect to your database in two ways.
Direct mode: your database is reachable from the Internet (or through a tunnel/VPN already in place). No additional installation is needed — simply enter the host, port, database name and the pwr user's credentials directly in the "Connections" tab of your account.
Agent mode: your database is not publicly exposed (the most common case in enterprises). The Collector is installed on a machine that has access to PostgreSQL and itself establishes secure outbound connections to PWR and Cloudflare. Its download and personalized configuration are only available in your account area.
Agent mode — What is the Collector?
The Collector is a single-tenant agent installed within the client's infrastructure, on a machine able to reach the PostgreSQL database to be supervised. It acts as a secure local gateway between PostgreSQL and PWR: the database stays private and is never directly exposed to the SaaS.
It loads its local configuration from config/.env, keeps the connection to PostgreSQL alive, collects metrics and snapshots, exposes diagnostic and report routes, then sends the SaaS the heartbeats and data needed to track the instance.
The Collector and cloudflared are two separate processes installed as native services. The Collector talks to PostgreSQL and PWR; cloudflared only publishes the Collector's local HTTP API through an encrypted outbound tunnel.
- collection of live metrics, snapshots and PostgreSQL report data
- dedicated authentication with the PWR Collector Token
- local, per-client isolated configuration in config/.env
- heartbeats, status reporting and last-activity tracking
- protected local API for on-demand diagnostics and operations
- remote access with no inbound port opened, thanks to the Cloudflare tunnel
Agent mode — Responsibilities of the Collector project and the PWR backend
Everything that runs on the client's machine belongs to the Collector project. That repository owns the agent's full lifecycle and produces the artifacts distributed for each operating system.
The PWR backend stays a provisioning and control service. It never installs cloudflared, never creates the system services, and never builds the executables: it supplies the Collector with the personalized secrets and information it needs, then tracks its installation and activity.
- Collector project: cross-platform installer and automatic cloudflared installation
- Collector project: Windows, Linux systemd and macOS launchd services
- Collector project: installing and starting the Collector as a native service
- Collector project: writing and protecting the local configuration
- Collector project: testing /health locally then via the Cloudflare URL
- Collector project: generating per-platform executables, archives and packages
- PWR backend: creating the Cloudflare tunnel and generating the Tunnel Token
- PWR backend: assigning the Collector's public URL
- PWR backend: authenticated API to download the personalized configuration
- PWR backend: tracking the Collector's installation, heartbeats, status and last activity
Agent mode — How a request flows between PWR and your database
The Collector connects locally to PostgreSQL to capture snapshots and compute metrics. It then sends its heartbeats and snapshots to the PWR backend over HTTPS, using its own token.
For on-demand operations, cloudflared maintains a named tunnel to the Collector's local HTTP server. This tunnel only ever uses an outbound connection from the client machine: no router or firewall port is opened toward the Internet.
The Cloudflare subdomain and the Tunnel Token are created by PWR for this connection. The PWR Collector Token and the Cloudflare Tunnel Token are two distinct secrets.
PostgreSQL stays isolated: only the Collector installed inside the client network connects to it. The SaaS and Cloudflare never obtain PostgreSQL credentials over a public route.
Agent mode — Prerequisites on the client's database side
Before starting the agent, the client's PostgreSQL database must have the pwr user created in step 1, with at least SELECT on pg_stat_* (for live data) and on the perfhist schema (for every report), plus the right to execute its functions/procedures — already covered by pg_monitor and the GRANTs above.
The pg_stat_statements extension must be enabled (CREATE EXTENSION IF NOT EXISTS pg_stat_statements;, requires shared_preload_libraries to include pg_stat_statements + a restart): it is required for both live data and reports (top queries).
Agent mode — Prerequisites on the machine hosting the agent
No Python installation is needed with the standalone installer provided by PWR.
The machine must be able to reach PostgreSQL on its port (5432 by default), PWR over HTTPS (443), and Cloudflare outbound. No public inbound port is required.
Installing the Collector and cloudflared services requires administrator rights on Windows, root/sudo on Linux, or the equivalent rights on macOS.
Agent mode — Guided walkthrough in your account area
In Connections, create a connection in Agent mode. Progress then shows a fourth step, Collector installed, and a "Continue installation" button.
The My Collector page provisions the Cloudflare tunnel, shows its URL and status, then offers - only within your authenticated area - the artifact matching your operating system.
Download the installer archive, the personalized .env file, and collector-install.json. The latter temporarily contains the PostgreSQL settings and must never be shared.
Agent mode — Automatic installation
Unzip the archive and place collector-install.json in the same folder as the installer. The My Collector page shows a personalized command ready to copy.
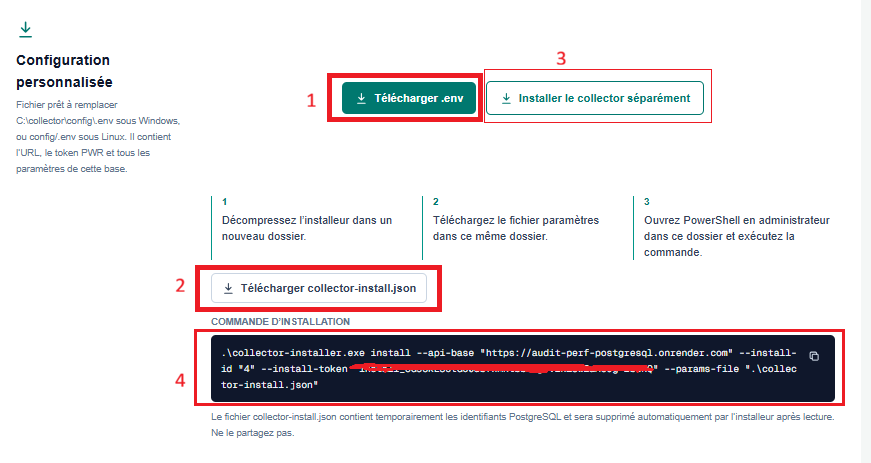
Open PowerShell as administrator on Windows, or a terminal with the required privileges on Linux/macOS, in that folder, then run the command shown in your account.
The installer fetches the full configuration from the backend, writes config/.env with restricted permissions, installs cloudflared and the Collector as native services, starts the services and checks /health locally then via the tunnel.
collector-install.json is automatically deleted after the installer reads it.
.\collector-installer.exe install --api-base "<PWR URL>" --install-id "<ID>" --install-token "<TOKEN>" --params-file ".\collector-install.json"Agent mode — Windows walkthrough: from the folder to the native service
Once the archive is unzipped, the folder contains collector.exe, collector-installer.exe, .env and config. Run in that folder, the personalized command shows every step live: fetching the configuration, deploying the binary, writing config/.env, checking/installing cloudflared, then installing the Collector service.
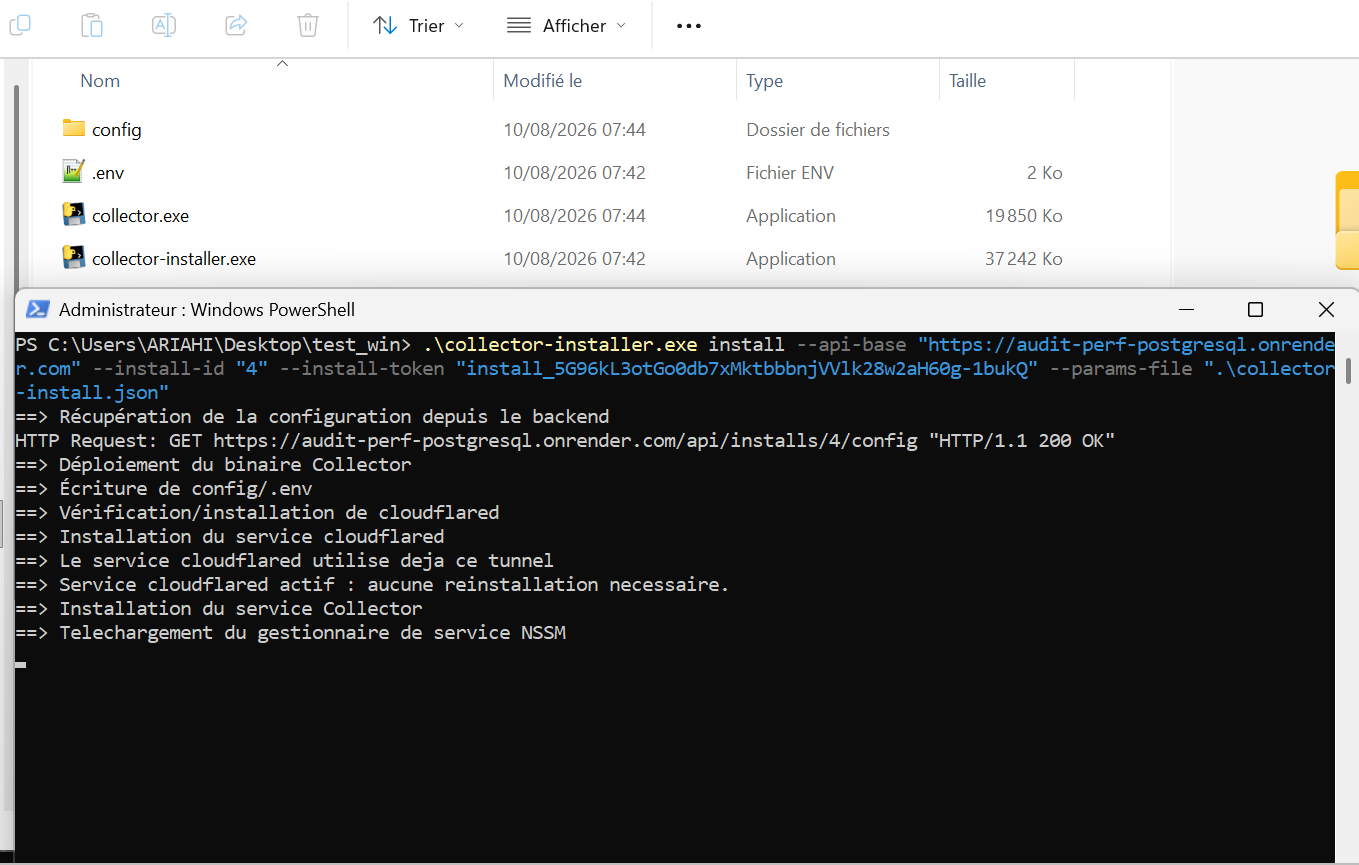
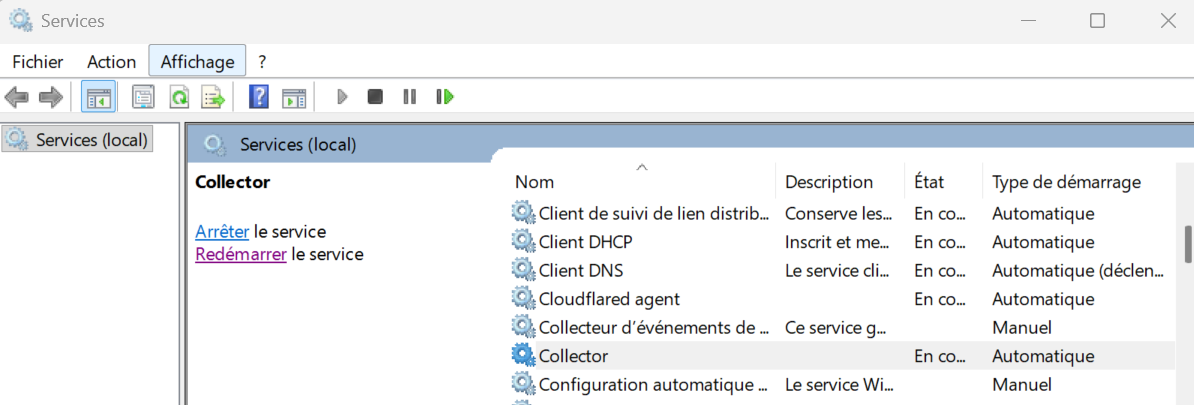
The installer automatically detects the machine's operating system at run time, with no manual choice required: on Windows, it installs the Collector and cloudflared as two native Windows services (via NSSM, downloaded and verified automatically if needed); on Linux, as systemd units; on macOS, as launchd agents. The command to run is the same, only the downloaded artifact changes depending on the OS chosen in your account area.
Once installation is complete, Collector and Cloudflared agent appear in the Windows services (services.msc), both in the Running state with an Automatic startup type: they restart on their own with the machine, with no manual action needed after a reboot or an outage.
Agent mode — Linux walkthrough: from the folder to the native service
On Linux, make the downloaded binary executable then run the personalized command with sudo: the installer must run as root to write the systemd units for the Collector and cloudflared. The command shows every step live: fetching the configuration, deploying the binary, writing config/.env, checking/installing cloudflared, installing the services, then checking /health locally and via the tunnel.
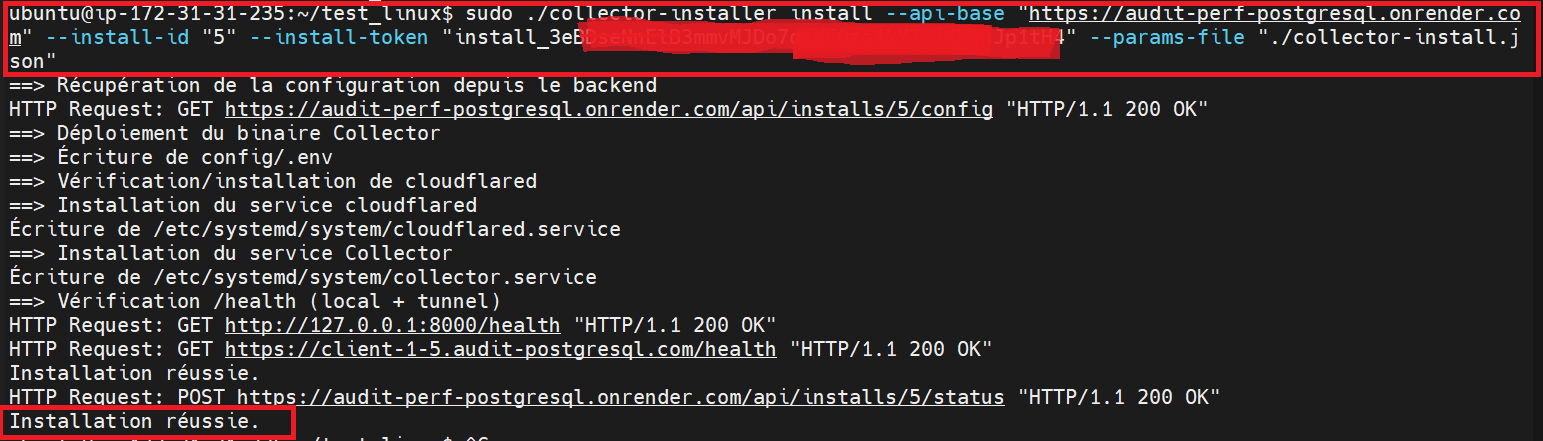

The installer automatically detects the machine's operating system at run time, with no manual choice required: on Linux, the Collector and cloudflared are installed as two independent systemd units (/etc/systemd/system/collector.service and cloudflared.service); on Windows, as two native services; on macOS, as launchd agents.
Once installation is complete, systemctl list-unit-files confirms that both collector.service and cloudflared.service are enabled: they start automatically with the machine, with no manual action needed after a reboot or an outage.
chmod +x collector-installerAgent mode — Tracking the installation
During installation, the installer reports its status back to the backend: installing, installed, or failed with the associated message.
Once the Collector has started, its heartbeats update Collector connected and the last activity in your account area. The progress on the Connections page then moves to 100%.
On failure, first check PostgreSQL connectivity from the Collector's machine, then rerun the personalized command after fixing the issue.
Test-NetConnection -ComputerName <db_host> -Port 5432Downloadable resources